What Is a Golf Launch Monitor and How Does It Work?
A golf launch monitor is no longer limited to tour vans or elite teaching studios. Today, golfers can use one beside a practice mat, indoors or outdoors, to examine what the club and ball actually do. The device measures data such as ball speed, launch angle, spin rate, carry distance, and club path. It then turns those measurements into numbers, charts, or simulated shots.
The process is technical but easier to understand than it first appears. Radar-based units track movement through microwave signals, while camera-based systems capture rapid images around impact. Some models use both methods. At contact, the monitor identifies the ball’s speed, direction, and rotation. It may also estimate club delivery details, depending on its sensors and software. A small misread can change the result.
That matters in real practice. A golfer might see a 10-yard fade on screen, then check the clubface and swing path before changing technique. I once assumed longer carry always meant better contact. That idea is incomplete. Wind, range balls, setup quality, lighting, and limited calibration can influence the reading. Good coaches compare several shots, not one impressive number. They also check whether the result matches the golfer’s visible ball flight.
This guide explains what a golf launch monitor measures, how its tracking systems work, and where its limits appear. It also considers accuracy, practical setup, and useful ways to interpret the data. Numbers can guide a decision. They should not replace judgment, consistent practice, or qualified instruction.
What a Golf Launch Monitor Measures: 30+ Parameters in TrackMan Systems
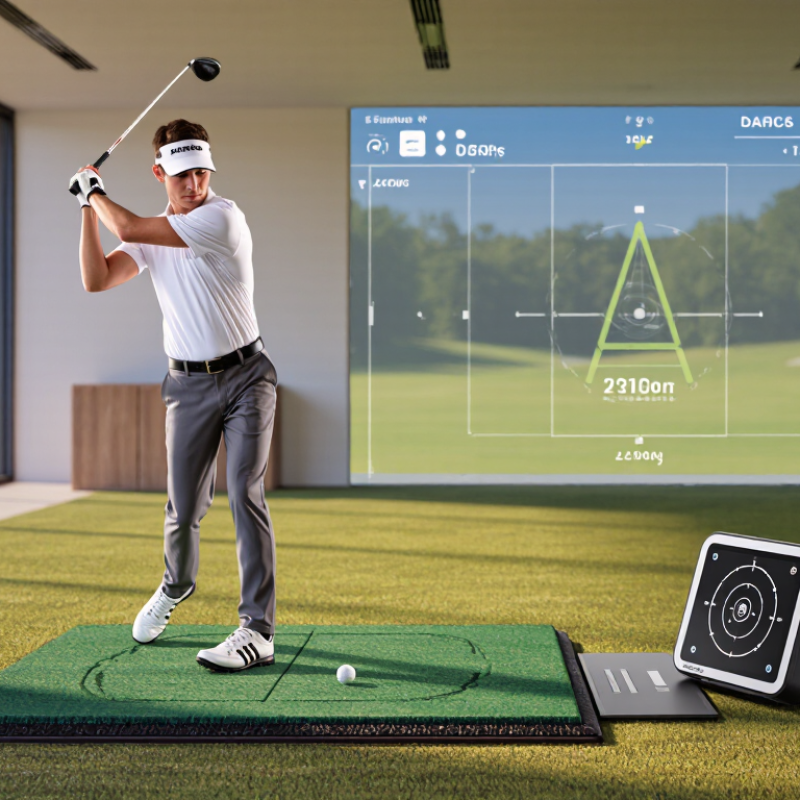
A golf launch monitor measures what happens between the club and the ball. Cameras or radar track movement through impact and during flight. The system then converts that data into practical feedback for practice, fitting, and course planning. In a real session, I watch ball speed first, but I do not trust one reading alone. Contact quality, lighting, alignment, and calibration can change the result.
A modern system may record more than 30 parameters. Ball measurements include ball speed, launch angle, launch direction, backspin, sidespin, spin rate, spin axis, carry distance, total distance, lateral distance, peak height, descent angle, flight time, hang time, and landing position.
Club measurements can include club speed, attack angle, swing path, face angle, face-to-path, dynamic loft, loft at impact, lie angle, impact location, closure rate, low point, and smash factor. It may also show horizontal launch, vertical launch, carry efficiency, and estimated rollout.
These numbers work best together. A high smash factor can suggest centered contact, while a closed face and rightward path may explain a pull-hook. Carry distance is often more useful than total distance on a wet course. Still, the model makes assumptions about weather, turf, and ball behavior. No reading is perfect. I have seen players chase extra speed while ignoring a two-millimeter strike error. That choice can make a longer swing less reliable. Consistent setup and repeated shots usually reveal more than one impressive result.
How Radar and Photometric Sensors Capture Club and Ball Data
What Is a Golf Launch Monitor and How Does It Work?
A golf launch monitor measures what happens between the club’s swing and the ball’s flight. It uses radar, photometric cameras, or both technologies. The system records club speed, ball speed, launch angle, direction, and spin. These details help golfers connect swing feel with measurable results.
Radar
Radar sends electromagnetic waves toward the club and ball. The returning signal changes when either object moves. This change, called the Doppler effect, helps calculate speed and direction. Some radar systems track the ball after impact, while others focus more closely on the clubhead. Indoor radar needs enough space for reliable ball-flight readings. Shorter flight paths can make spin estimates less certain.
Photometric Sensors
Photometric sensors use high-speed cameras to capture rapid images around impact. Software studies the clubface, ball position, and visible rotation across several frames. Small differences between frames reveal launch direction, face angle, and spin behavior. Lighting, camera alignment, and dirty lenses can affect the readings. The data may look precise and still be wrong. That is worth remembering.
During practice, a golfer might see a slice begin with an open clubface, not simply an outside-in path. Skilled fitting specialists compare several shots instead of trusting one result. Radar and camera systems can disagree slightly. Calibration, ball quality, and impact location often explain the difference. A launch monitor provides evidence, but careful interpretation remains essential.
The Core Launch Metrics: Speed, Launch Angle, Spin, and Carry Distance
What Is a Golf Launch Monitor and How Does It Work?
A golf launch monitor uses cameras, radar, or both to measure what happens after impact. Its core metrics are speed, launch angle, spin, and carry distance. Clubhead speed describes how fast the club moves before contact. Ball speed shows the energy transferred into the shot. Carry distance measures only the ball’s flight, not its final roll.
Launch angle controls the ball’s initial height. Too low, and the shot falls quickly. Too high, and energy may be wasted. Spin adds stability and shapes the flight. A driver with excessive spin can climb, stall, and lose distance. The 2024 Distance Insights Report from the R&A and USGA places average professional driving distance near 300 yards for men and 260 yards for women. Those figures show speed matters, but launch conditions decide how efficiently speed becomes carry.
Tips: Test ten shots, not one. Keep the ball position consistent. Watch patterns instead of chasing your longest result. Indoor readings can differ from outdoor shots because lighting, setup, and environmental assumptions affect measurement. I have also seen golfers trust impressive numbers too quickly. That is a mistake. A monitor is useful evidence, not an oracle. Recheck unusual readings with clean contact and a stable stance.
How Algorithms Convert Impact Data into a Predicted Ball Flight
A golf launch monitor turns impact into a flight forecast. Sensors capture club speed, ball speed, launch angle, spin rate, and direction. Radar tracks movement through space. Cameras identify the clubface and ball immediately after impact.
An algorithm then combines these measurements with physics. It estimates lift, drag, gravity, and spin decay. Numerical calculations predict carry, total distance, height, and curve. A small change in face angle can shift the landing position dramatically.
The 2023 Distance Insights Report from the R&A and USGA placed elite male professional driving distance near 300 yards. That figure shows why precise launch data matters.
The prediction is useful, but not perfect. Indoor systems may estimate landing behavior without seeing the complete flight. Wet grooves, poor lighting, or a slight sensor misalignment can distort results.
I have also found that golfers trust impressive numbers too quickly. The algorithm may be accurate, yet the swing remains inconsistent.
Tips:
Check calibration before hitting. Use clean balls and clubs. Compare predicted carry with outdoor results. Watch repeated patterns, not one spectacular shot. A monitor is a measuring tool, not a verdict.
Why Indoor and Outdoor Readings Differ Across Professional Systems
What Is a Golf Launch Monitor and How Does It Work?
Why Indoor and Outdoor Readings Differ Across Professional Systems
A golf launch monitor measures club speed, ball speed, launch angle, spin, and carry distance. It uses radar, cameras, or both. Professional systems also estimate the ball’s complete flight path.
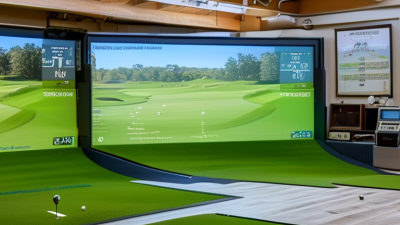
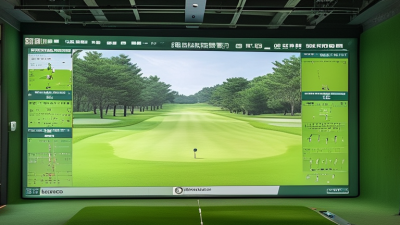
Indoor readings depend heavily on impact data. The ball may travel only a few metres before striking a screen. Software must then model the remaining flight. Small errors in spin rate can change the projected carry by several yards. The selected ball, screen distance, lighting, and alignment also matter. No reading is perfectly neutral.
Outdoor systems can observe the full ball flight. They capture changing wind, temperature, elevation, and air density. Those factors create more realistic results, but they can also increase variation. A crosswind may move the ball eight yards sideways without changing the player’s swing. Uneven turf can alter strike quality too. That detail is easy to miss.
The 2023 PGA Tour statistical archive recorded an average driving distance of about 299.9 yards. Such figures reflect outdoor competition conditions, not protected indoor rooms. The USGA and R&A equipment standards test golf balls under controlled conditions, including a 255-foot-per-second initial velocity limit and a 317-yard total-distance limit. These standards improve comparability, but they do not make every monitor identical. A practical fitting lesson is simple: compare readings on the same system, with the same ball, setup, and environment. Even then, question unusually perfect numbers.
What Is a Golf Launch Monitor and How Does It Work?
Representative readings for the same 150 mph driver shot: indoor systems calculate carry from measured launch data, while outdoor systems can compare the shot with actual ball flight.
Indoor and outdoor readings can differ because indoor systems usually track the ball over a short distance and use a flight model to estimate carry. Outdoor systems have more room to observe the complete trajectory, so wind, air density, landing behavior, and model assumptions can affect the final result. Ball speed and launch angle are generally more stable than estimated carry distance.